GIS stands for geographical information systems. It’s really any electronic map, and can include much more than where just things are. A typical GIS problem might be something like finding the safest routes for cyclists by analyzing records of bike accidents by location, and combining that with street maps, or maybe finding the best locations for a new business, using maps of parcels and calculating their proximity to busy roadways and wetlands. There are many jobs that require at least some level of knowledge in GIS, and the library, as well as national, state, and local government, have resources if you’d like to learn more!
Without getting into the weeds, some terms need to be defined. GIS maps have different “layers.” A layer is another level of information added to the map, and can be a “vector” layer (shapes like points or lines) or a “raster” layer (made of pixels, like an image). An example of a vector layer would be roadways, and a raster could be something like Earth’s surface temperature, measured from a satellite. Two other terms you’ll encounter are “projection” and “coordinate reference system” – these describe how the round surface of Earth is mapped to a flat computer screen.
To get started, you might like to explore some resources online. The US Geological Survey has a neat tool called EarthExplorer. This website gives you access to all kinds of data for the US, including satellite measurements and aerial photography. On the state level, the Florida Department of Environmental Protection offers an open data portal for exploring and download maps of things like soil types, wetlands, and derelict marine vessels. The City of Gainesville has their own open data portal, DataGNV, with data on things like code violations, traffic accidents, and water features.
For viewing and manipulating GIS data that you download from those websites, there are some popular tools, a couple of which are free. The real heavy hitter is ArcGIS, a piece of software you have to pay for. They do offer online tutorials, valuable if you are looking to learn for a job. QGIS is a powerful and free software for Windows, Mac, and Linux. It has most of the capabilities of ArcGIS. Google Maps is well known, but they also have their My Maps service, where you can upload your own vector data. It’s limited, but free and easy to use. For instance, I’ve used My Maps, along with a GPS logger on my phone, to look at some of my bicycle routes through Gainesville.
Finally, the library’s O’Reilly collection of software and technical references has many books to learn any of these GIS tools. For ArcGIS, a good place to start is Introducing Geographic Information Systems with ArcGIS: A Workbook Approach to Learning GIS. Practical GIS was invaluable to me for getting started with QGIS. Google Maps gets into great detail about how to create your own web applications using Google’s service. If you don’t like reading software manuals as much as I do, the LinkedIn Learning (formerly Lynda.com) service has courses on all these GIS tools.
As an example, I’ll show how to take data from the city of Gainesville, and plot and style it in Google Maps.
Navigate to https://data.cityofgainesville.org and click on “Geospatial.”
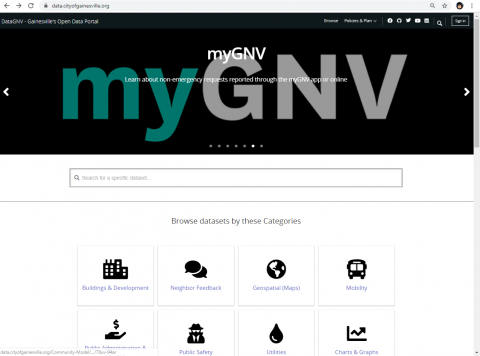
Browse through the datasets. I’ll use two I know will fit in Google’s 5 MB limit: “Monthly crime incidents” and “Wetlands”.

Click on the link of the data you want. When it’s opened, look in the upper-right hand corner for “Export.”
The crime data I download as a filtered csv file, and the wetlands as a KML file. This file format is a shapefile – it describes the shapes of wetland areas and where they are.
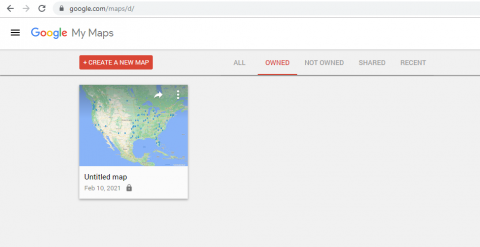
Navigate to https://mymaps.google.com and log in with your Google account, or create one if you don’t have one already.
Click on “Create a new map.”
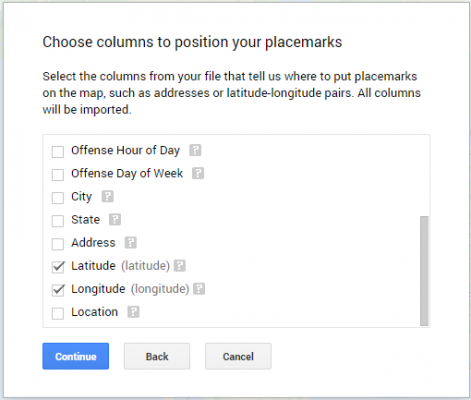
Here, you upload the file you download. First I do the crime data. Mymaps asks what columns of the data are position: select latitude and longitude.
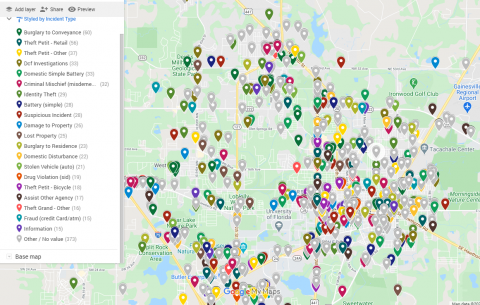
The data is plotted, but you can style it. Click on the style option in the left-hand pane. I style by incident type. This gives each incident type its own color.
Add a layer, then upload the wetlands shapefile. It takes a moment and then Mymaps shows the wetlands.
At the bottom of the pane, you can select the base map. Let’s choose satellite.
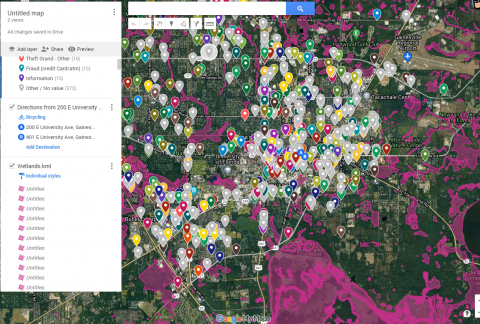
Finally, I click on the circles and lines icon in the toolbar near the top. This lets you draw shapes, points of interest, or driving directions. I choose biking directions.
Double click on your start and end points. I chose Alachua County Library District Headquarters and Gainesville City Hall.
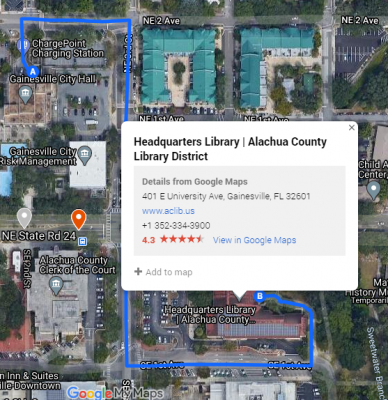
Then save your map, and give it a name. You can share it with other people if you like.
Originally Posted by Joaquin on April 1, 2021